Paul Taykalo Staff Software Engineer
Fixing Slow Project Compilation Times on Modern Hardware

- #Objective-C
• 15 min read
Introduction
CleanMyMac X is a relatively large macOS app written primarily in Objective-C and Swift. It's a complex project with many dependencies that has been around for some time, and just as any other large project, it has its own set of problems, one of them being slow compilation times.
Over time, we've implemented various solutions to speed up its compilation process, including use of incremental builds and prebuilt frameworks, optimizing build settings and project structure, and maximizing concurrent compilation in builds. While the total build time was always under control, there was still that one bothersome issue: the time it took to compile a few specific files in the project. That time was unexpectedly high, and there were no apparent reasons for it.
Solving that puzzle took a substantial amount of time since our first attempts in 2019, and it has brought a few discoveries along the way.
The problem of slow dependencies compilation
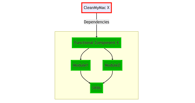
We organize CleanMyMac X project into several high-level components based on their functionality. Underneath the high-level components, we have two separate utilities and model layers. On top of these two bottom levels of utilities and models, we have applications with their own UI and business logic.
Here is a simplified diagram of the project structure:
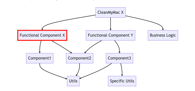
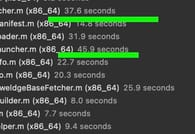
During the full project build process, most bottom targets were compiling fast, and there were no issues. But a few files in the Functional Component X were constantly taking their sweet time to compile. Hardly can one expect one .m file to be compiled in 40 seconds on modern hardware, right? Those compilation times looked even more bizarre if you considered that the file in question had less than 10 lines of code. Or that in case of other higher-level components, 10-20 files per second were compiled, if not more.
It wasn't that bad since it only happened on the clean builds. Incremental builds were fast, as expected. But every Xcode developer knows they can fix most errors by cleaning the DerivedData folder. So, whenever we had to clean DerivedData to fix some Xcode issues, we had additional 40 seconds of waiting time for that already frustrating process. Because of that, but primarily out of curiosity, the investigation of this issue started.
Investigation part 1. The "Sleeping Beauty"
One would expect that each .m file is compiled by a separate clang compiler instance. Checking how many instances of clang were running during the build of that particular 10-line file brought unexpected results: 16 instances of clang were running in parallel! But the number of instances wasn't as surprising as the CPU usage — which was around 66% for just one process and 0% for the rest.
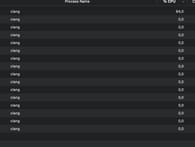
Wow. It seemed that it didn't matter how many cores there were if only one of them did all the work.
Getting into clang internals
The next step was to take a sample clang process and check its stack trace. From the call stack, it was clear that almost all processes were waiting and, more precisely, sleeping. It was hard to get more detailed information since the call stack wasn't symbolicated. So after a bit of googling, the best decision seemed to be to implement a specialized clang version with blackjack and debug logs. As clang is an open-source project, one can clone its repo from GitHub and proceed to build it:
https://github.com/llvm/llvm-project
After mere few days of playing with documentation and asking questions on StackOverflow and in local chats with developers who had experience with LLVM and clang, a specialized version of clang was born. The hardest part was figuring out which parameters to pass to cmake to build the project — clang supports many different build systems, architectures, and platforms. So the challenge was removing unnecessary things and building only what was needed.
It is relatively easy to change the compiler for the Xcode project. All we need to do is just change two variables in the xcconfig file:
CC=~/Projects/llvm/install/bin/clang
CCX=~/Projects/llvm/install/bin/clang++
Aaaand it didn't work. There were tons of errors, which weren't that helpful. But somehow, they conveyed the message "This isn't clang we are looking for." The issue is that Apple has its own version of clang, and Apple often doesn't share sources. But luckily, clang version used in Xcode is also open source. We just needed to get it from another repo:
https://github.com/apple/llvm-project
After a few more hours, it was possible to build a project with the specialized version of clang. It was time to check what was the deal with all that sleeping.
Picking the lock
With a custom-tailored compiler, things started to move forward. It was possible to see the call stack of the processes, and it was clear that all of them were waiting for the same lock.

What was happening is that once Xcode started to build the Functional Component X, it spawned multiple instances of clang for each file in that component. Say, to correctly build the Functional Component X, it needed to build Component1 and Component2 first. In general, one could expect that by the time when the Functional Component X starts to build, all its dependencies are already built. But for some reason, it wasn't the case.
When clang needs to resolve a dependency, it checks if the file is already built. If so, clang just uses it. If not, clang checks if the dependency is building right now by another instance of clang. If so, it waits for the other instance to finish. If not, it acquires a lock and starts building the dependency. Here's how we can visualize this logic:
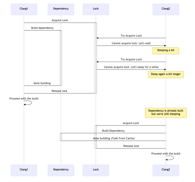
Clang1DependencyLockClang2Sleeping a bitSleep again a bit longerDependency is already builtbut we're still sleepingAcquire LockBuild dependencyTry Acquire LockCannot acquire lock. Let's waitTry Acquire LockCannot acquire lock. Let's sleep for a whiledone buildingRelease lockProceed with the buildAcquire LockBuild Dependencydone building (Took From Cache)Release lockProceed with the buildClang1DependencyLockClang2
Here are some interesting lines from the LockFileManager.cpp file:
/// For a shared lock, wait until the owner releases the lock.
/// Total timeout for the file to appear is ~1.5 minutes.
/// \param MaxSeconds the maximum total wait time in seconds.
WaitForUnlockResult waitForUnlock(const unsigned MaxSeconds = 90);

WaitMultiplier *= 2;
if (WaitMultiplier > MaxWaitMultiplier) {
    WaitMultiplier = MaxWaitMultiplier;
}
So the longer the compiler is waiting for the lock, the longer is the sleep time becoming. Could we do anyting about it?
The first solution
The first attempt at fixing this started with the search for some solution that won't wait for the lock. Since the lock implementation in LLVM creates a lock file, it seemed possible to use some kind of file system events to listen to for the lock release (basically the event of removing the lock file). There's a library called kqueue that does pretty much that — it allows us to listen for the file system events. And more importantly, it is available on macOS, so we don't need no external dependencies.
With this in mind, here's how one possible based fix based on kqueue can work: instead of sleeping while waiting for lock, the compiler would subscribe to the file system events, and will get a notification when the lock is released.
Once the solution was working, it was time to share it. The most natural solution in such situations is to open a pull request to the LLVM repo on GitHub, discuss it, and then merge it. But the LLVM project has a pretty complex process of submitting changes. We need to create a patch, submit it to the mailing list, wait for the review, and then wait for someone to merge it.
Here's the patch in question on the LLVM reviews site.
Following this path can be tough for multiple reasons:
- Not being a C++ developer
- Not being familiar with the codebase, and LLVM is a huge project
- Doing it during free time after work
- Overall, this process of submitting a patch could be clearer and easier to understand.
And in the end, there's no guarantee that the patch will be accepted. In our case, there was another pull request that was trying to solve the same problem but slightly differently. Basically, Ladd user suggested limiting the maximum time that the compiler will sleep while waiting for the lock:
// Since we don't yet have an event-based method to wait for the lock file,
// implement randomized exponential backoff, similar to Ethernet collision
// algorithm. This improves performance on machines with high core counts
// when the file lock is heavily contended by multiple clang processes
const unsigned long MinWaitDurationMS = 10;
const unsigned long MaxWaitMultiplier = 50; // 500ms max wait
unsigned long WaitMultiplier = 1;
unsigned long ElapsedTimeSeconds = 0;
It is a good solution — it is simple, it works, and it doesn't require or rely on the complex logic of system events. Currently, LLVM is using the solution proposed by Ladd.
That whole process can be a really interesting experience, allowing to learn a lot on the way. When you finally manage to drill down to the problem's root cause and fix it, that feeling is really satisfying.
And even though the patch was not accepted, there was that whole custom version of clang for local use. However, installation and maintenance of a custom compiler was too much of a hassle for use in our team. So we decided just to wait for the fix to be merged into the LLVM repo.
The end...?
Investigation part 2. It should be fast, right?
Fast forward to the year 2023. A lot of things changed. The CleanMyMac X project grew, and we rewrote most of it. Apple released a new build system. We also now have M1 Macbook Pro laptops, and they are blazingly fast. So the project compilation should be fast, too, right? It's the 21st century, after all.
The problem strikes again
How long does it take to build the project on today's hardware? Is it 5 minutes? Maybe 10 minutes? A whole hour? Obviously, it depends on the project size, but there should be some upper bound. As developers, we always want to have a fast feedback loop. The faster we can see the results of our changes, the better.
Remember those waiting times when clang was waiting for the lock? Well, they were still there. Not as bad as before, but still there.
We have multiple targets in the project, and while most were building fast, some were struggling. It seemed that only some files were causing the problem. And it was strange, while most of the files in other targets were building fast, as in 10 files per second or so, these files were building for dozens of seconds each.
Dozens of seconds for a single file? On the Apple M1 in 2023? Seriously?

The choke point
Given the familiarity with the problem, it was possible to quickly set up the project again and start investigating, relatively quickly locating the method in clang that seemed to be the culprit of delays:
compileModuleAndReadAST(
    CompilerInstance &ImportingInstance,
    SourceLocation ImportLoc,
    SourceLocation ModuleNameLoc,
    Module *Module, StringRef ModuleFileName) {
It looked like for some reason the compiler was having trouble when building one of the source modules. Let's take a moment here to revise how clangworks with modules, and then get to why it can take the compiler so long to build one.
What is a module?

The official clang documentation explains it pretty well, but in short, a module is a way to organize the source code. We can represent a dependency like a library or a framework as a module. We can split it into multiple modules if it is a big library.
When our target depends on a module, the compiler is actually interested in the module interface (header files organized by module maps). So the compiler precompiles the module interface and then can reuse that information when other targets need that information.
Precompiled module interfaces are stored in the cache in the PCM format. Those PCM files are created for each dependency, whether it is a system framework or not:
.build/DerivedData/ModuleCache.noindex/3GVC60OTD7R0S/Foundation-1XMN11U6GYNC8.pcm
.build/DerivedData/ModuleCache.noindex/3GVC60OTD7R0S/AppKit-1XMN11U6GYNC8.pcm
PCM files cache
But if PCM files work like a cache, why does it take so long to build? More than that, when we were building CleanMyMac X, all its dependencies should have already been built and stored in the cache. So why clang was building the dependencies again?
At that point, there were two main hypotheses:
- Somehow, the PCM cache was invalidated when building the top-level targets, for example, due to some weird race conditions.
- Top-level targets were not reusing the PCM cache.
First things first, let's try to understand what can cause PCM cache invalidation. Some digging into the code allows us to see that when a .pcm file is generated, it contains a signature used for cache invalidation. And that signature is generated based on every bit of the module interface. So, basically, even a small change in the module could cause the cache to be invalidated.
After some playing with the code, it became apparent that going down that rabbit hole would require understanding the whole clang codebase. And we don't really want to do that. So let's put that idea aside for now and switch to the second hypothesis.
Difference in the PCM files
If we search in the documentation for any additional information, we can find out that there is a command that allows to dump information about PCM files in a human-friendly format:
clang -module-file-info <path to PCM file>
Here is the gist of its output for a module of the AppKit framework.
We can write a script (or even ask ChatGPT for it) to check if a .pcm file has changed in the compilation flow. When building the project a few times, we select a specific .pcm file and track if it changes, which allows us to gradually understand if all .pcm files always stay the same. If it works so, we can then assume that once a .pcm file is generated, it never changes.
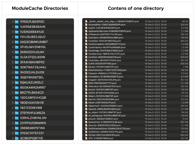
But in practice, some targets were using PCM files from different directories. Those directories contained the same set of PCM files, with names fully matching, but the content of those files was different:
./.build/DerivedData/ModuleCache.noindex/  25WGJ3ZHJ6332  /Foundation-1XMN11U6GYNC8.pcm
./.build/DerivedData/ModuleCache.noindex/  3UU6V472V783N  /Foundation-1XMN11U6GYNC8.pcm
./.build/DerivedData/ModuleCache.noindex/  H6DQB240ZJHB   /Foundation-1XMN11U6GYNC8.pcm
./.build/DerivedData/ModuleCache.noindex/  3B85C81QBGQUK  /Foundation-1XMN11U6GYNC8.pcm
./.build/DerivedData/ModuleCache.noindex/  3MW80CL1WV63C  /Foundation-1XMN11U6GYNC8.pcm
./.build/DerivedData/ModuleCache.noindex/  3GVC60OTD7R0S  /Foundation-1XMN11U6GYNC8.pcm
If we compare those files we can find something really interesting:
<       -DNDEBUG=1
<       -DUSE_DEBUG_LOGGING=1
---
>       -DNDEBUG=0
>       -DUSE_DEBUG_LOGGING=0
There were some other differences, but these were the most interesting ones. There actually is an association between the PCM module cache and compilation flags:

So, the PCM files are used as a cache only if the preprocessor flags are the same. And in our case, it was far from that. Almost every target had some different flags. We were using those as feature flags, inlinable constants, and other things. So in the end, we had a lot of different caches, each one for a specific set of flags.
So this is what was happening. Most of the targets on the same level used the same preprocessor flags. The first part of the build was pretty fast and consistent, but as soon as the compiler moved to one of the top-level targets with a different set of flags, it had to rebuild the whole PCM cache for all dependencies, starting from the system frameworks and ending with our own modules.
Compiler flags that solve the problem
The solution was pretty simple: review all the targets and re-check if we really needed to have different flags. And even if we need them, there's a way to have preprocessor flags that won't affect the PCM cache.
If we were to describe the solution in one sentence, it would be: "Use GCC_PREPROCESSOR_DEFINITIONS_NOT_USED_IN_PRECOMPS instead of GCC_PREPROCESSOR_DEFINITIONS."GCC_PREPROCESSOR_DEFINITIONS_NOT_USED_IN_PRECOMPS has the same effect, but the flags defined there won't be used as input for the unique signature of a .pcm file.
Actually, this setting works the same as GCC_PREPROCESSOR_DEFINITIONS, but add additional flags for the compiler setting fmodules-ignore-macro=for each definition provided in GCC_PREPROCESSOR_DEFINITIONS.
Results
To measure if the changes actually made any difference, we ran a benchmark on the whole CleanMyMac X project with the Hyperfine tool.
The results were astonishing: the build time now was twice as fast in the debug configuration and almost 25% faster in the release configuration!
| Hardware | Configuration | Time Before | Time After | Difference |
|---|---|---|---|---|
| M1 Pro | Release | 272.759s ± 5.314s | 208.813s ± 6.231s | ~**23.2%**faster |
| M1 Pro | Debug | 164.854s ± 10.120s | 84.332s ± 3.440s | ~**48.7%**faster |
| Intel x86_64 | Debug | 342.321s ± 39.102s | 157.229s ± 2.561s | ~**54.2%**faster |
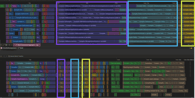
This how it looks like in Xcode (the same components are highlighted with the same color):
Conclusion
That was a really interesting ride. It started with a simple question 4 years ago and ended with this article, allowing one to try and learn many things. This issue was particularly interesting as there were no apparent signs of the problem. It was just a slow build, and we were used to it.
Our current hardware is fast. So if our project compiles in 10 minutes because "it was always like that," we should try to check if that statement is true, even if this will require debugging the compiler itself.